"How much did we sell to our top ten customers last quarter?"
That question doesn't get an answer. It gets a ticket. Someone on the ERP team runs a report, fixes it up in Excel, and sends it back a day later.
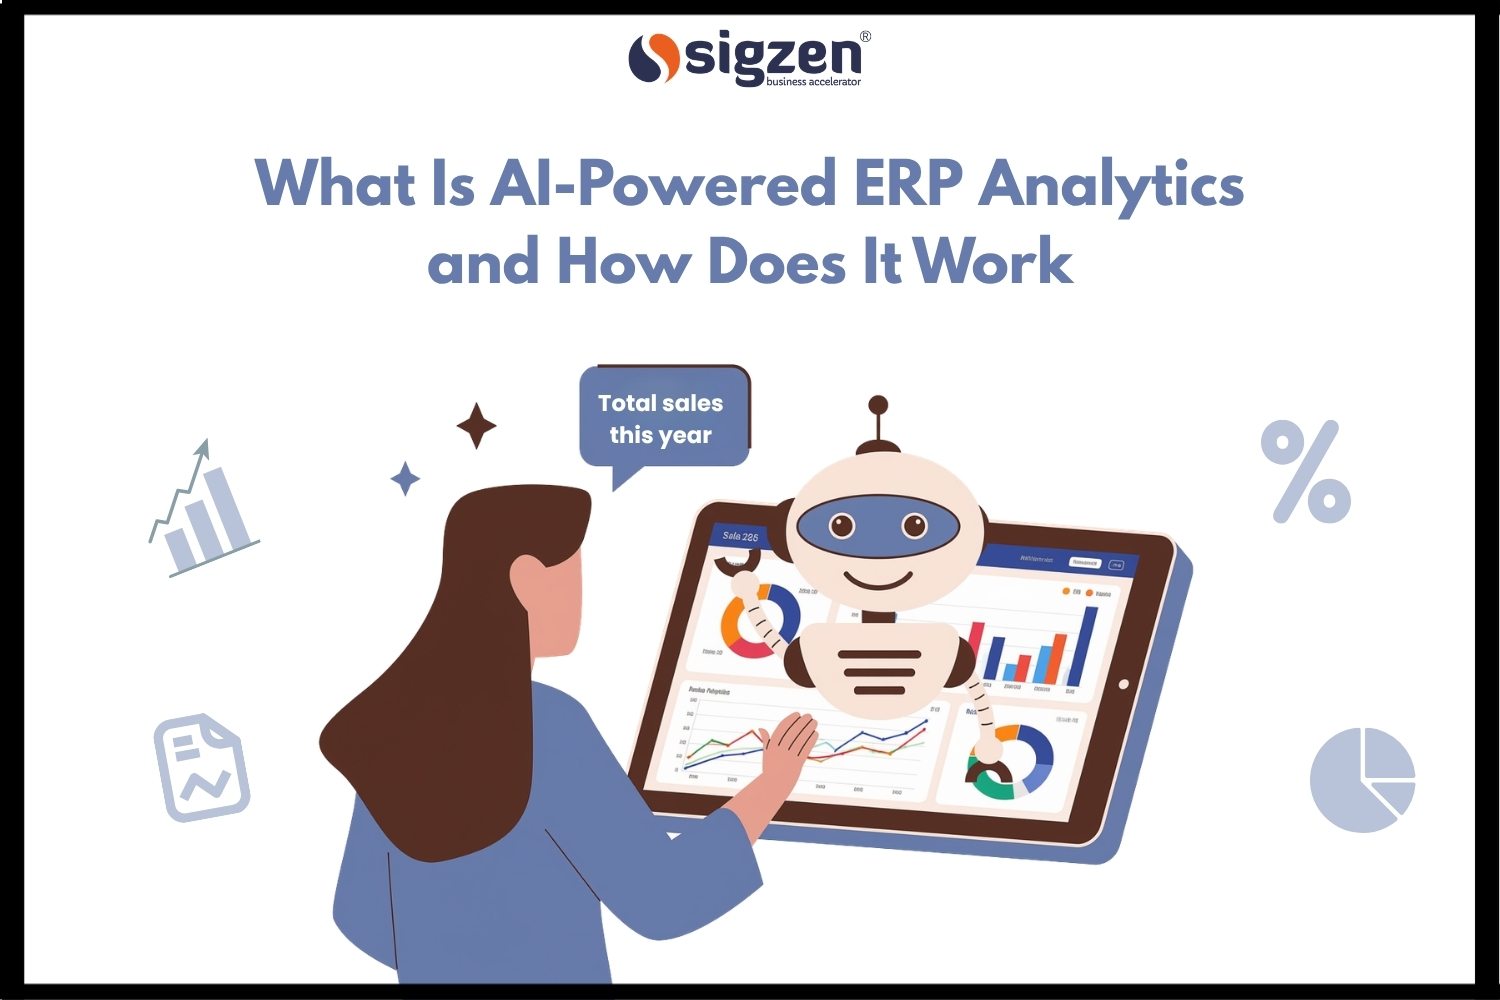
AI-powered ERP analytics closes that gap. It lets anyone on your team ask the ERP a question in plain English and get back a chart built from live business data. No SQL, no report builder, and no waiting on IT.
But here's what most guides skip. Getting an answer from AI is easy. Trusting that answer is the hard part.
Below, we walk you through what AI ERP analytics is, how it works step by step, and how to tell a verified number from a guess.
AI-powered ERP analytics, explained simply
AI-powered ERP analytics is software that reads your ERP data and answers business questions in plain language. You type a question like "What was gross profit by branch last month?" The AI turns it into a query, runs it on your data, and shows the result as a chart or table.
Think of it as a smart layer on top of the ERP you already run. Your sales orders, invoices, stock entries, and payroll records stay where they are. The AI learns how to ask them the right questions.
There are a few kinds of AI analytics, and we cover each one below. For now, the core idea is simple: the person with the question gets the answer directly.
Standard ERP reports vs AI analytics
Your ERP already has reports. ERPNext, for example, ships with a long list of standard reports and a drag-and-drop report builder.
The problem isn't missing reports. It's that each report answers one fixed question in one fixed layout. If your question doesn't match a report, someone who knows the data model has to build a new one.
Here's how the two compare in daily use:
- Who can use it: Standard reports need a trained user. AI analytics works for anyone who can type a question.
- What you get: A report gives one set view. AI analytics builds the chart that fits the question you asked.
- New questions: A new report usually means a request to a developer. With AI analytics, you just ask.
- Follow-ups: "Why did sales drop in March?" becomes your next question, not a new ticket.
Tax and legal reports like GST returns and the balance sheet should stay fixed and checked. AI analytics is for the hundred everyday questions around them.
Why separate BI tools often stall
Before AI, the usual fix was a separate business intelligence (BI) tool. These tools draw good charts. The trouble is getting ERP data into them.
Most need a data warehouse, plus an ETL pipeline that copies your data out every night. ETL stands for extract, transform, load: pulling data out, cleaning it, and loading it somewhere else.
AI analytics built for your ERP avoids most of that. SigzenBI, AI business intelligence for ERPNext, reads your data where it already lives. There's no warehouse to build and no nightly copy to maintain.
That still leaves the bigger question: can you trust what the AI tells you? To answer it, let's first look at the three kinds of AI ERP analytics.
Three kinds of AI ERP analytics
Not every AI analytics tool does the same job. Most fall into three groups, and each one answers a different kind of question.
Ask-and-answer analytics
This is the type described in the definition above. You ask a question in plain words, and the system returns a number, chart, or table.
It answers "what happened" and "where." Examples include sales by region, top suppliers by spend, or stock that hasn't moved in 90 days. Follow-up questions let you drill down without waiting for a new report.
You'll also see this called natural language analytics or conversational analytics. SigzenBI belongs in this group.
Forecasting analytics
Forecasting tools use past ERP data to predict what comes next. Common uses are demand planning, cash flow estimates, and spotting customers who may pay late.
These tools find patterns in history, like seasonal peaks or payment habits, and carry them forward. The catch is simple: a forecast can only be as good as the history it learns from.
If two teams count "sales" in two different ways, the model learns from mixed numbers. The forecast looks exact, but it rests on a weak base.
Alert and outlier analytics
Alert tools watch your data in the background and flag anything unusual. Think of a duplicate supplier invoice, a sudden jump in returns, or stock falling below a safe level.
Some alerts follow simple rules you set, like "tell me when stock drops below 50 units." Others use AI to learn what normal looks like and flag what doesn't fit.
Alerts save people from scanning reports for problems. But too many alerts turn into noise fast, so the rules need regular tuning.
Which kind most teams need first
Forecasts and alerts sound exciting, but both depend on numbers people already agree on. Ask-and-answer analytics is where that agreement gets built.
Gartner makes a similar point. In an April 2026 press release based on a survey of 314 organizations, Gartner says AI spending only pays off when it rests on strong governance, clear reasoning behind each result, and data that's ready to use.
So how does ask-and-answer analytics turn a typed question into a number you can trust? Here's the process, step by step.
How AI-powered ERP analytics works, step by step
Most AI analytics tools follow the same five steps. The gap between a trusted answer and a confident guess shows up in steps two and five.
Step 1: You ask a question in plain English
You type a question the way you'd ask a colleague. For example: "What was gross profit by branch last month?"
The AI reads the question and breaks it into parts. Here, that means one measure (gross profit), one way to split it (by branch), and one time window (last month).
Good tools also handle loose wording. "GP" and "gross profit" should lead to the same place. "Last month" should mean the last full month, not the past 30 days.
Step 2: The AI maps it to a business metric
This is the step most people never see, and it matters most. The AI has to decide what "gross profit" actually means in your ERP.
In ERPNext, that choice has real detail. Should it count only submitted invoices, or drafts too? Should it subtract credit notes and returns, and should it use the posting date or the date the record was created?
There are two ways to handle this. Some tools let the AI work it out fresh each time, while others map the question to a metric your team has already defined and checked. The next section explains why that difference matters so much.
Step 3: A read-only query runs on your ERP data
Once the metric is clear, the system writes a database query. A query is a precise request, like "add up these invoice values, grouped by branch, for September."
That query should only ever read data. Safe setups use a database user that can run read-only lookups and nothing else, so the AI can't edit, delete, or post a single record.
Where the query runs matters too. With SigzenBI, for example, queries run on your own ERPNext server, and only the result rows travel back. The SigzenBI security model explains this in full.
Step 4: The answer comes back as a chart or dashboard
The system picks a view that fits the question. Trends over time usually become line charts, while branch-vs-branch comparisons become bar charts.
You can then keep going. "Show only the Ahmedabad branch" or "compare it with last year" works as a follow-up, with no new report to request.
Some tools can also build a full dashboard from one request, such as "build me a CFO overview," and pick the panels for you.
Step 5: You check the logic behind the number
A number with no explanation is hard to defend in a meeting. A trustworthy tool shows its working: the metric used, the rule behind it, and the query that ran.
It should also know its limits. If a question falls outside the approved metrics, the right answer is "I can't answer that reliably," not a made-up figure.
Step two is where AI analytics tools differ the most, so it's worth a closer look.
Text-to-SQL vs a verified metric layer
An AI can turn your question into a query in one of two main ways. Which way it uses decides how far you can trust the answer.
What goes wrong when AI writes queries from scratch
Text-to-SQL means the AI reads your question, looks at your database tables, and writes a fresh query every time. SQL is the language databases use to find and add up records.
It sounds ideal, and on simple questions it often works. The trouble starts with business rules that table names don't show.
In ERPNext, these are the usual problems:
- Counting drafts and cancelled records: ERPNext keeps draft and cancelled invoices in the same table as submitted ones. If the query misses that filter, sales look higher than they are.
- Double counting: If invoice lines are joined to payments the wrong way, the same sale gets counted twice.
- Shifting meanings: Ask about "sales" on Monday and again on Friday, and the AI may write two different queries. You get two answers to one question.
- Made-up names: Models sometimes invent a table or field that sounds right but doesn't exist.
Researchers test this skill with BIRD, a public text-to-SQL benchmark built on 95 large databases. When BIRD launched in 2023, ChatGPT got about 40% of queries right, against about 93% for human experts.
Models have improved fast since then. In March 2026, one research system matched human experts on a cleaned-up version of the test. But even a tool that's right 95% of the time gives one wrong number in twenty, and nothing tells you which one.
How a semantic layer keeps one meaning of "sales"
A semantic layer is a list of approved business metrics, each with a fixed rule behind it. "Gross profit" is defined once, checked by people who know the books, and reused every time someone asks.
This changes the AI's job. Instead of writing SQL from scratch, it matches your question to the right approved metric, and the system builds the query from that fixed rule.
That fixes the "two reports, two numbers" problem at the root. Finance, sales, and the owner all see the same gross profit, because it comes from the same rule.
SigzenBI works this way. It ships with 186 ERPNext metrics that are defined and checked before anyone asks, covering ten modules from sales to quality to HR. You can read how SigzenBI checks its numbers for the full method.
The trade-off is reach. A metric layer can only answer questions its metrics cover, so a new kind of question means adding a new metric first.
An example makes this clearer. Here's one question traced from start to finish.
AI-powered ERP analytics in action: one question, start to finish
Here's how the five steps play out on a real kind of question. Say you run finance at a distributor that uses ERPNext, and the owner wants to know how this year is going.
You type: "How does gross profit this year compare with last year, by month?"
Reading the question
The AI breaks the question into parts. The measure is gross profit, the split is by month, and the comparison is this year against last year.
If your business runs more than one company in ERPNext, the tool should also check which company you mean. A good tool asks, or uses the company tied to your login, instead of quietly adding them all together.
Matching it to an approved metric
Next, the AI finds the approved "gross profit" metric. A typical rule for gross profit in ERPNext looks like this:
- Sales come from submitted sales invoices only, so drafts and cancelled invoices are left out.
- Cost is based on the stock value of the items sold, taken at the time of sale.
- Returns and credit notes reduce both sales and cost.
- Amounts use the company's base currency.
- Each invoice falls into a month by its posting date.
Every one of those choices changes the final number. That's why they're settled once, by people who know the books, and not guessed by the AI on the spot.
Running the query
The system builds the query from that rule and runs it read-only on your ERPNext server. Your invoices and stock records never leave the database.
What comes back is a small table of monthly totals, one row per month for each year. That table is the only thing that travels to the chart.
Showing the answer
The answer appears as two lines on one chart, this year against last year. One glance shows where the gap opens up.
Say August looks weak. You ask a follow-up, such as "Which item groups caused the drop in August?", and get a new chart in seconds, with no report request needed.
Checking the number
Before taking August to the owner, you open the working behind the chart. It shows the gross profit rule above and the exact query that ran.
That small table of results raises a fair question, though. Where exactly does your data go when you use AI analytics?
ERP data security in AI analytics: where your data goes
Your ERP holds your prices, margins, salaries, and customer list. Before any AI tool touches it, you should know exactly where that data travels.
This is a real risk, not a small worry. IBM's Cost of a Data Breach Report 2025 found that 97% of organizations with an AI-related security incident lacked proper AI access controls. The same report puts the global average cost of a breach at $4.44 million.
Three ways AI tools reach your ERP data
Most AI analytics tools connect to your ERP in one of three ways:
- Copy it to a warehouse: Your data gets copied out, often every night, to a separate store. You now have two copies of your books to protect.
- Log in to your database directly: The AI service keeps your database username and password and runs queries over the internet. If that service is breached, attackers may reach your database too.
- Run a read-only gateway on your server: A small app sits next to your ERP. Queries run locally, and only the results go out.
The third model keeps the most control in your hands. It's the one SigzenBI uses.
How SigzenBI handles your ERPNext data
The SigzenBI app installs on your own ERPNext server. Here's what that means in practice:
- Queries run on your server, read-only, against your own database.
- SigzenBI's central service sends the query and receives only the result rows. It never holds your database password and has no way to connect to your database.
- Setup creates a database user that can only read. That means read-only is enforced by both the software and the database itself.
- Queries against Frappe's login, session, and password tables are refused.
- Your database is never exposed to the internet.
- It works with self-hosted ERPNext, Frappe Cloud, or Sigzen hosting.
The result rows that do leave your server are protected too. There's no shared warehouse, each customer's data is kept fully separate, and row-level security is enforced on the server.
Who sees what: roles and access
Security isn't only about outsiders. Inside your company, not everyone should see salaries or branch margins.
Good AI analytics respects roles. You decide who sees which dashboard and who can use the AI chat, and row-level rules keep each person to the data they're allowed to see.
Strong security still doesn't make AI analytics perfect. Here's what it can't do.
AI-powered ERP analytics for ERPNext: how SigzenBI works
SigzenBI is AI business intelligence built only for ERPNext. Sigzen Technologies, a certified ERPNext and Frappe partner, built it and supports it.
It follows the approach covered above. Questions are answered from verified metrics, queries run read-only on your server, and the tool says so when it can't answer.
What SigzenBI does
Anyone on your team can type a question in plain English and get a chart back. You can also ask for a whole dashboard in one request, and SigzenBI picks the metrics and lays out the panels.
Here's what sits behind each answer:
- 186 verified metrics, each defined and checked before anyone asks a question.
- 10 ERPNext modules covered from one chat box, from sales and stock to quality and HR.
- 50+ chart types, including trends, pivot tables, funnels, heatmaps, and maps.
- Visible working: every number shows the metric rule and the query behind it.
Most BI tools start with an empty screen and a long setup project. SigzenBI starts with nine ready-made dashboards that build themselves on your live ERPNext data.
There's no data warehouse to build and no ETL pipeline to set up. The portal runs on your own domain, so your team never has to leave your ERPNext site.
How setup works
Getting started takes five steps:
- Sign up for the 14-day free trial. No card is needed.
2) Connect your ERPNext through the read-only gateway. Self-hosted, Frappe Cloud, and Sigzen-hosted sites all work.
- Open your dashboards. The nine starter dashboards appear on your real data.
4) Invite your team and set who sees which dashboard and who can use the AI chat.
- Start asking questions in plain English.
Every account gets email support from Sigzen's ERPNext team, with onboarding help as you add users.
What SigzenBI doesn't do
It's worth being clear about the limits too. SigzenBI reports what has already happened in your business. It does not forecast demand, cash flow, or customer churn.
It is also not a general BI tool for blending ERPNext with many other systems. It isn't built for second-by-second live streaming data either.
If you need any of those, Sigzen's ERPNext team can scope that work as a separate project. For the everyday questions about sales, stock, purchases, and margins, SigzenBI is built to answer them directly.
To see it on real data first, take the SigzenBI interactive tour.
AI-powered ERP analytics lets anyone on your team ask the ERP a question and get a chart back, with no SQL and no report request. The real value doesn't come from the AI alone. It comes from being able to trust the number.
Here's what matters most:
- Start with ask-and-answer analytics. Forecasts and alerts only work once people agree on the numbers underneath.
- Prefer a verified metric layer over raw text-to-SQL. One approved rule per number means one answer per question.
- Keep queries read-only and on your own server. Your database stays out of reach, and only results travel.
- Choose a tool that shows its working. It should also say "I can't answer that" instead of guessing.
If your business runs on ERPNext, the next step is to test this on your own data. Start a 14-day free trial of SigzenBI on your live ERPNext, with no card needed. Then check the first few answers against your existing reports.
Prefer to see it first? Book a 20-minute demo and bring the questions your team asks every week.
Frequently asked questions
What is AI-powered ERP analytics?
AI-powered ERP analytics is software that answers business questions from your ERP data in plain language. You type a question, and the AI maps it to a business metric, runs a read-only query on your data, and returns a chart or table. For everyday questions, it removes the need for SQL, custom reports, or a request to IT.
How is AI ERP analytics different from a regular BI tool?
A regular BI tool usually needs your data copied into a warehouse and dashboards built by a specialist. AI ERP analytics reads your ERP data where it already lives and lets anyone ask questions in plain English. The trade-off is scope: ERP-specific tools go deep on one system, while general BI tools can blend data from many systems.
Is text-to-SQL safe to use on ERP data?
Text-to-SQL can work, but it's risky for business numbers. When AI writes every query from scratch, it can miss ERP rules like leaving out draft or cancelled invoices. Two people asking the same question may also get two different answers. A verified metric layer is safer, because each number comes from a rule your team has already checked.
Does AI ERP analytics need a data warehouse?
Not always. Older BI setups need a warehouse and an ETL pipeline that copies ERP data out every night. Tools built for one ERP, such as SigzenBI for ERPNext, read your existing database through a read-only connection instead. That means no second copy of your books to build, maintain, or protect.
Can AI ERP analytics forecast demand or cash flow?
Some AI ERP analytics tools forecast, but not all of them. Forecasting tools learn patterns from past data and project them forward, so they need clean, consistent history to work well. SigzenBI focuses on reporting what has already happened, such as sales, stock, and margins. It does not forecast demand, cash flow, or customer churn.
Does my ERP data leave my server with AI analytics?
It depends on the tool. Some copy your data to a warehouse, and some store your database password. With SigzenBI, queries run read-only on your own ERPNext server, and only the result rows go back to the service. Your database password is never shared, and your database is never exposed to the internet.
Is SigzenBI a good fit for my company?
SigzenBI fits companies that already run ERPNext and want their team to get answers without learning SQL. It works best in three situations: Business users want answers without going through IT. You run more than one company, branch, or warehouse and need one meaning for each number. You want dashboards working in days, not months.
How long does it take to set up SigzenBI?
SigzenBI is built to go live in days, not months. You sign up for the 14-day free trial with no card needed, then connect ERPNext through the read-only gateway. Nine starter dashboards build themselves on your live data. After that, you invite your team, set access, and start asking questions.
Reader rating
How useful was this article? Tap a star to rate.